Leveraging Innovative Data Analytics to Empower MedTech Companies with Foresight for Strategic Growth
In the fiercely competitive and rapidly evolving global medical device industry, the ability to accurately grasp market dynamics, discern competitive landscapes, and formulate forward-thinking strategies has become paramount for sustainable corporate success. Against this backdrop, a critical determinant of success lies in transforming vast amounts of data into strategically significant business intelligence. Leveraging data- and intelligence-driven insights is essential to support and guide medical device companies, startups, and investment institutions in making informed, data-driven decisions.
The Sleeping Giant: Re-evaluating the Strategic Value of Public FDA 510(k) Database
The U.S. FDA’s Premarket Notification 510(k) database, traditionally viewed primarily as a pathway for regulatory compliance, is, in fact, a “data goldmine” containing immense strategic value.
Specifically, each 510(k) clearance record contains applicant information, product codes, key technological features, and approval timelines, and indirectly reflects market innovation focal points and technological evolution trajectories. These seemingly independent data points can be interconnected with systematic analytical methods to form a clear picture depicting industry dynamics, assessing competitive positioning, and even foreseeing emerging development opportunities. For instance, consider the insights from reports like: “Who’s Leading the Pack? Who’s Catching Up? | 2025 Q1 FDA 510(k) Clearances: Market Opportunities and Strategic Signals Revealed by Intelligence.”

Figure 1: Overview of U.S. FDA Class 2 Medical Device 510(k) Clearances
As illustrated in Figure 1, as of May 2, 2025, Class 2 510(k) clearance data alone has accumulated over 130,000 records, contributed by approximately 25,000 different applicants from 83 countries worldwide, covering nearly 2,800 medical device product codes. Such a profound data foundation provides a solid basis for advanced business intelligence analysis.
It must be emphasized here that the FDA 510(k) database reflects the regulatory approval status of medical device clearances. The data source does not include post-market commercial performance data such as product sales, market share, clinical application efficacy, adverse events/product recalls, or insurance reimbursement for cleared devices. Therefore, the analytical methods and data insights proposed in the subsequent sections of this article aim to extract “leading indicators” of applicant innovation activity and potential impact. These analytical results should be cross-validated with actual market performance, clinical validation data, and other multi-source information to achieve optimal decision-making benefits.
Unlocking the Key: The RFM Analysis Model – An Innovative Application Framework for MedTech Intelligence
Wispro Technology Consulting’s research team, drawing inspiration from the classic RFM (Recency, Frequency, Monetary/Value) analysis model, has innovatively applied its core logic to the intelligence analysis of FDA 510(k) data, developing an evaluation framework targeting “applicants” for 510(k) clearances. Basic concepts are exemplified below:
Recency (R): Recent Activity (Applicant_Idle_Yr)
- Observation Logic: Calculate the time interval since a specific medical device company last obtained an FDA 510(k) clearance.
- Strategic Implication: Reflects the company’s current R&D and market responsiveness.
Frequency (F): Clearance Frequency (Applicant_Approvals)
- Observation Logic: Tally the “total number” of FDA 510(k) clearances obtained by a specific medical device company within a defined period.
- Strategic Implication: Signifies the extent of resource investment in R&D and market activities, as well as their continuity.
The R-F cross-analysis matrix for 510(k) applicants, as shown in Figure 2, presents a diverse and insightful landscape of market participants. These data combinations offer valuable clues for medical device companies, startups, and investment institutions to understand the dynamic competitive landscape of MedTech market participants. Among them:
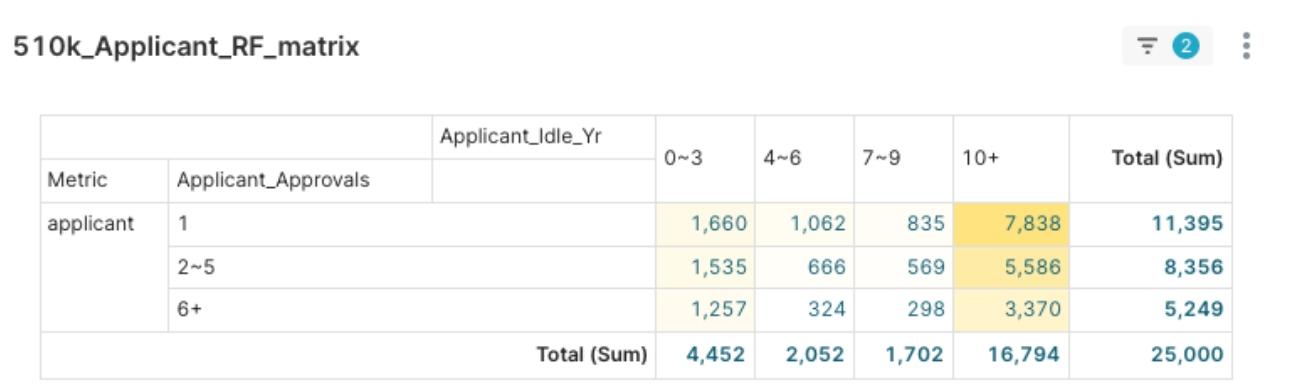
Figure 2: Decrypting Market Dynamics: FDA 510(k) Applicant RFM Analysis of R (Recent Activity) and F (Clearance Frequency)
- Recent Activity (R): Approximately 4,452 companies have remained active in the last 3 years, while a significant 16,794 applicants have had no new clearances for over ten years.
- Clearance Frequency (F): Approximately 11,395 applicants historically have only one clearance, whereas “seasoned players” with six or more clearances number around 5,249.
- R-F Cross-Analysis further reveals applicants with 6+ clearances: (1)Among the 4,452 applicants active in the last 0-3 years, 1,257 are “Consistent Leaders.” (2) Among applicants inactive for 10+ years, 3,370 are “Past Leaders.”
Beyond the R and F dimensions, the classic RFM (Recency, Frequency, Monetary/Value) analysis model includes a crucial third dimension—Monetary/Value, discussed next.
Value (V) / Monetary (M): A Conceptual Exploration of “Value/Potential”
- Core Concept: Due to the inherent limitation of FDA 510(k) public data sources lacking direct financial data, this dimension is transformed into a broader “Value (Potential)” for conceptual exploration. The goal is to explore proxy indicators from regulatory clearance data that can directly or indirectly reflect technological innovativeness, market impact potential, or strategic importance.
- Illustrative Example: Using “510(k) Submission Type“
- “Traditional” submissions are typically for new or significantly modified devices, potentially implying higher R&D investment and innovative intent.
- “Special” submissions are often for modifications to a company’s existing products.
- As shown in Figure 3, “Traditional” submissions constitute the absolute majority (87.03%) of Class 2 device clearances. We found a question to discuss: Can the proportion of different submission types in an applicant’s portfolio indirectly reflect their product and technology innovation strategy?
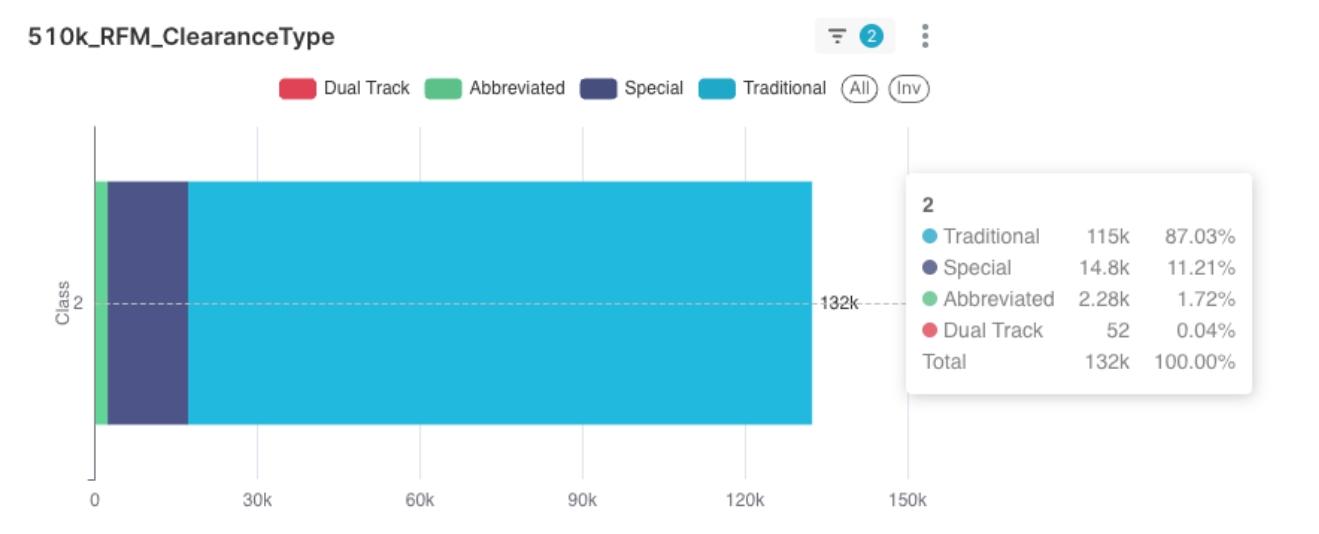
Figure 3: Discerning "Value" Trends: Distribution of Submission Types for Class 2 Medical Device 510(k) Clearances and Initial Value Insights
Important Considerations and Methodological Evolution:
- Illustrative Example, Not Definitive: In this article, we used “Submission Type” as a V proxy, a highly simplified “conceptual illustration.” Observations from Figure 3 suggest it alone is insufficient to form a mature or significantly differentiating V dimension.
- Inherent Limitations of 510(k) Data: FDA 510(k) public data primarily focuses on regulatory approval and technical comparisons, lacking direct market performance data or detailed clinical application efficacy.
- MedTech Clearances Beyond 510(k): This article focuses solely on 510(k) clearance data. Future analyses will separately address De Novo and PMA clearance data.
- Complexity and Future of V-Dimension Exploration: Accurately measuring “Value/Potential” is central to the ongoing refinement of this analytical method. Wispro Technology Consulting is committed to exploring and validating more diverse V-dimension proxy indicators (e.g., NLP text mining, Predicate Device citation network analysis, linking with external relational databases). These in-depth methodologies, indicator construction, and how to set specific R, F, V scoring criteria and weights, will be key topics for further discussion in our subsequent case shares and upcoming events.
Through this preliminary exploration of R, F, and the V dimension’s conceptual direction, we can transform FDA clearance data into a strategic lens for understanding market dynamics, evaluating competitors, and identifying potential areas of opportunity.
Empowering Decisions: Strategic Value Creation for MedTech Stakeholders via Applicant RFM Analysis
This innovative, applicant-centric data analysis framework offers forward-looking strategic benefits to various participants in the MedTech value chain:
- For Established Medical Device Companies: Optimize R&D pipelines and product strategies. Gain insights into their own and competitors’ recent activity (R), clearance frequency (F), and initial value inclination (V-direction) to avoid missing market opportunities. Deepen competitive landscape assessment and identify strategic collaboration or M&A targets.
- For Medical Device Startups: Pinpoint market entry points by identifying opportunity windows with low activity but high potential value. Strengthen product uniqueness narratives and present market opportunities in a data-driven manner to enhance fundraising appeal.
- For Investment Institutions: Enhance investment target evaluation models by incorporating FDA applicant RFM analysis into due diligence processes. Discern forward-looking industry development trends and strengthen risk control capabilities to make more robust investment decisions.
Considerations and Future Outlook for This Analytical Framework
The RFM framework based on FDA 510(k) data also has its prerequisites for application and areas for optimization, including inherent limitations in data coverage, the complexity of selecting V-dimension proxy indicators, the impact of regulatory environment changes, and data quality and cleansing challenges.
Stay tuned for our next article! We will present a case study on Product Code: EOQ (Bronchoscope (Flexible Or Rigid)), to further demonstrate the application of the Applicant RFM analysis method in a specific medical device field. You will see:
- An overall profile and recent dynamics of the EOQ market.
- The RFM characteristic distribution of major applicants in this market—who are the leaders? Who are the rising stars?
- What changes and challenges have new entrants brought to the EOQ market?
This concrete case study will give you a deeper appreciation of how RFM data analysis can help you identify opportunities, assess risks, and formulate more precise business strategies within specific MedTech market segments.